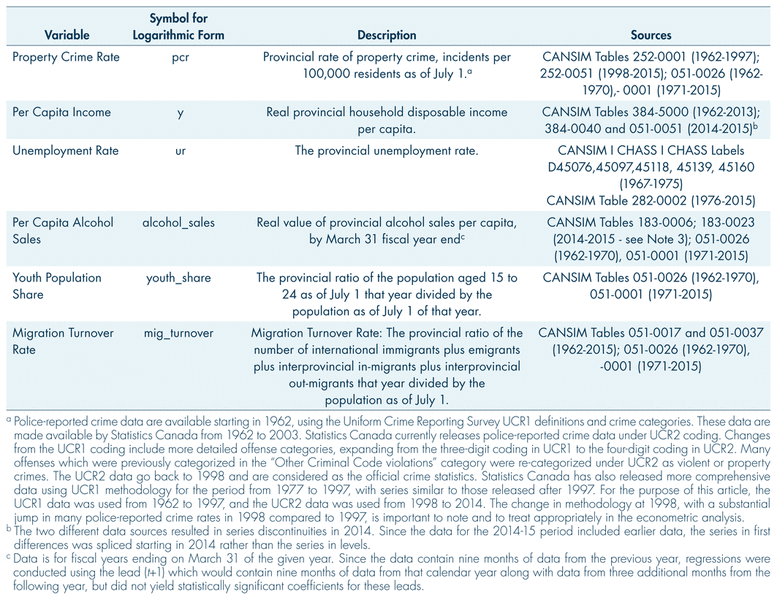
FIGURE 1 Rates of property crime, four western provinces and Ontario, 1962–2015.
Stuart Wilson*
ABSTRACT
Western provinces have experienced tremendous change over the last few decades, with oil booms and busts, with large international and interprovincial movement of workers and families, and with rising and declining property crime rates. What are the links between these economic, demographic, and crime rate changes? I investigate these links for Western Canada over the period from 1968 to 2015. Empirical results suggest that increases in household incomes and alcohol sales per capita, and decreases in unemployment rates, all signs of improved economic prosperity, coincided with decreases in rates of property crime. Increases in migration turnover (both inward and outward migration) put upward pressure on rates of property crime. In addition, changes in police reporting methods and categorization have had dramatic effects on official rates of property crime: the change from UCR1 to UCR2 reporting methodology caused rates of property crime to rise by between 18 per cent and 30 per cent in 1998, and changes in police reporting methods in 2003 caused property crime rates to rise again, by between 5 per cent and 16 per cent in 2003, for the western provinces. The recent rise in rates of property crime in the west is closely linked to the economic slowdown following the drop in oil and resource prices, and should migration turnover rates remain high as people move seeking better opportunities, property crime rates will remain high. Policymakers and criminal justice professionals may be advised and reminded of the effect of these economic and demographic changes, as well as the effect of reporting changes, on official rates property crime.
Key Words: Crime rate trends, economic growth, demographic change, police reporting
Crime rates trended downwards from 2003 to 2013 in western Canada, coinciding with an international resource boom. In particular, Saskatchewan experienced sharp increases in resource development, household income, and large in-migration movements, from both other provinces and nations, during a period termed the “Saskaboom”. Rapid economic and demographic change can have various effects on crime. Newcomers may have different behaviours and propensities to commit certain types of crimes. Improved employment outcomes of young males may reduce criminal activity. Inequalities in employment, incomes, and housing may lead to increased crime. Over the past few years with the decline in oil prices and revenues, some western Canadian provinces have experienced poor economic growth and increasing unemployment rates. What influence have demographic and economic changes had on crime rate patterns in the western Canadian provinces?
The economic factors that have been found to influence crime include changes in unemployment, in incomes, in inflation, in inequality, and in alcohol consumption (Cook & Zarkin, 1985; Raphael & Winter-Ebmer, 2001; Savoie, 2008; Pernanen, Cousineau, Brochu et al., 2002; Bunge, Johnson, & Balde, 2005, Andresen, 2013 among others). Research investigating the demographic factors that influence crime have tended to concentrate on the youth and migrant populations (Butcher & Piehl, 1998; Bunge et al., 2005; Kitchen, 2007; Stevens, Odynak, Brazil et al, 2011; Plecas, Evans, & Dandurand, n.d.). For more extensive reviews of the influences on crime, readers are encouraged to refer to Levitt (2004), Albertson & Fox (2012), Farrell, Tilley & Tseloni (2014), Tonry (2014), and Wilson, Sagynbekov, Pardy et al. (2015).
Tonry (2014) wrote that overall, there may be a role for economic and demographic forces in explaining property crime rate patterns over time, but little support for their influence on violent crime rate patterns. Recent work by Wilson (2017) supported this assessment by showing that economic and demographic change could help explain only minor changes in rates of violent crime, but may help explain up to 40 per cent of the changes in rates of property crime in western Canadian provinces over the last five decades. This article further focuses on assessing the economic and demographic influences on property crime in western Canada.
Police-reported crime data are available for Canadian provinces starting in 1962. The rates of property crime from 1962 to 2015 are depicted in Figure 1. Bunge et al. (2005) conducted time-series analyses on the influences on crime over 1962 to 2003 for Canada as a whole. This study serves as an extension of their work, with a larger time period, and with a larger dataset by pooling together data for the five provinces west of Quebec in a panel analysis.1 This study also serves as an extension of Wilson (2017) in three ways: (i) some explanatory variables, including inflation, were dropped due to statistical insignificance; (ii) the model allows for a singular focused effect of migration turnover on property crime, motivated by results which suggested that increases in interprovincial and international migrant movement, both inward and outward, had similarly positive impacts on property crime, and; (iii) the analysis incorporates data from the more recent period characterized by low resource prices.
|
|
||
|
FIGURE 1 Rates of property crime, four western provinces and Ontario, 1962–2015. |
||
The relationship between rates of property crime and the economic and demographic variables for the panel of five provinces (British Columbia, Alberta, Saskatchewan, Manitoba, and Ontario) is investigated using a linear panel model. The set of provincial economic and demographic variables used in the analysis are described in Table 1. These variables are real household disposable income per capita, the unemployment rate, per capita alcohol sales, the youth share of the population, and the migration turnover rate (the sum of both in- and out-migration, as a proportion of the total population). Provincial data for unemployment rates are only available starting in 1967. These variables all exhibit the property of nonstationarity, and therefore require transformation using logarithmic first differences to allow for estimation to overcome the problems of stochastic trends and spurious regressions; as such, this study may not be directly compared to that of Andresen (2013), which presented results from a panel study with variables in their undifferenced logarithmic forms.2 In addition, a set dummy variables was used to account for additional province-specific trends and shifts in rates of property crime. The effective time period of the study is from 1968 to 2015.
The results from the panel regressions for the growth in the rates of property crime over the study period are presented in Table 2. The first regression model includes contemporaneous and lagged independent variables, and a common constant term but with no other dummy variables. The estimates from that model are presented in Column 2, are identified as Model 1, and indicate how much variation may be accounted for solely by variation in the independent variables. The estimated fit of this first model is relatively low, with an overall R2 of 0.18, indicating that the explanatory variables used in this regression may account for a small portion of the variation in the growth of the rates of property crime over the sample. Only one variable, the unemployment rate, was statistically significant in the regression. The second regression model includes province-specific constant terms, and province-specific one-period and trend shift dummies which allow for trend changes that occurred around 1990, for an upward shift in 1998 with the movement to UCR2 reporting, and also for changes around 2003 (see notes to Table 2). The estimates from this model are identified in Column 3 as Model 2. This second regression performed much better in terms of the R2 statistic. The inclusion of these province-specific dummy variables allows the model to measure the impact of economic and demographic changes on property crime rates with better precision, and all of the economic and demographic variables have statistically significant effects on property crime rates, either contemporaneously, with lagged effects, or both. This model indicates how important it is to include these province- and time-specific effects to better identify the relationship between economic and demographic change, and changes in rates of property crime.
TABLE II Panel estimates of the growth in the rate of property crimea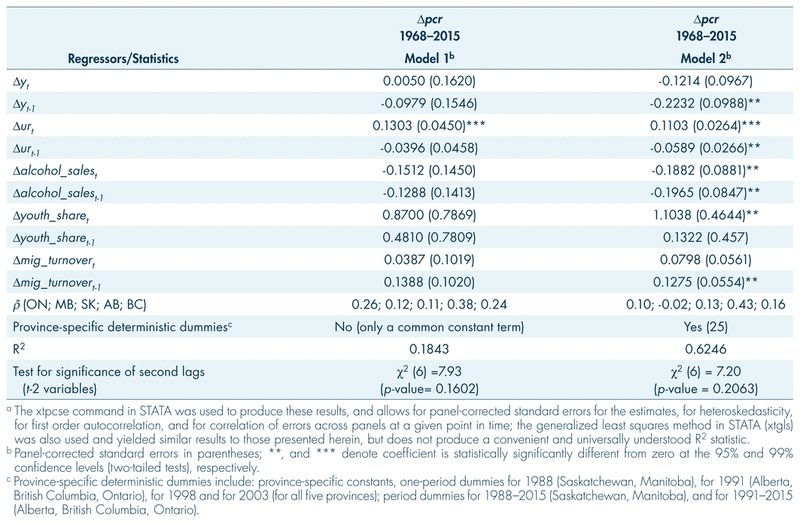
The estimates provided in Table 2 for Model 2, of the impact of economic and demographic changes on rates of property crime, will first be explained using a few illustrative examples. The coefficient estimates of −0.1214 and −0.2232 for Δyt and Δyt-1 suggest that for every one percentage point increase in the growth rate of real disposable household income per capita, the growth rate of the rate of property crime decreased by 0.12 percentage points, and the growth rate of the rate of property crime decreased by 0.22 percentage points in the following period, all else equal. The coefficient estimates of 1.1038 and 0.1322 for Δyouth-sharet and Δyouth-sharet-1 suggest that for every one percentage point decrease in the growth rate of the share of youth aged 15 to 24 years to the total population, the growth rate of the rate of property crime decreased by 1.10 percentage points, and the growth rate of the rate of property crime decreased by 0.13 percentage points in the following period, all else equal. While the other specific estimates themselves are of importance, it is appropriate and convenient to continue the analysis focusing on the direction of the influences of these variables on rates of property crime for the purpose of simplicity and ease of presentation.
As noted in one of the illustrative examples above, the empirical results indicate that there were negative contemporaneous and lagged relationships between changes in disposable income and changes in rates of property crime. In addition, there was a strong positive contemporaneous link between unemployment rates and property crime rates; however, that impact was partially muted with a counteracting negative effect of lagged unemployment rates. These results strongly suggest that improvements in the economy coincided with declines in rates of property crime, and that increases in property crime rates occurred during poor economic conditions, supporting a motivational effect of the economy on crime. Rates of property crime were also found to be negatively linked with contemporaneous and lagged changes in per capita alcohol sales. This result runs counter to the hypothesis that alcohol consumption and crime are positively linked, given a high proportion of crime is committed by individuals dependent and under the influence of alcohol and drugs (Pernanen et al., 2002). However, alcohol sales were positively correlated with disposable income, and are more likely a sign of increasing wealth and responsible alcohol consumption, so that these results reinforce the inference that increasing prosperity leads to declines in the rate of property crime.
Demographic change also had an influence on rates of property crime. Changes in the proportion of youth in the population and in the rate of migration turnover (both of inward and outward migration) were positively linked to changes in property crime. These results reinforce the age–crime link with adolescents committing a high proportion of crime in society (Gannon, Mihorean, Beattie et al., 2005; Brennan, 2012), and over the past decade while property crime rates have been falling, the proportion of youth in the population has also been in decline. While much international work has focused on the impact of immigrant populations on crime rates, in the Canadian context there is only suggestive evidence that, over time, an increasing share of immigrants may decrease rates of property crime (Zhang, 2014). Results presented herein indicate that the migration turnover rate, which measures the sum of inward and outward migration movements, had an impact on the rate of property crime, so that increasing migration turnover over the past decade put upward pressure on rates of property crime. This raises the question as to whether increasing migration turnover presents criminals with increased opportunities for property crime as people and their goods move in and out of the community, or whether the migrants themselves commit these acts.
Significant changes in the pattern of property crime rates occurred around 1990, 1998, and 2003. The quantitative impact of these changes is highlighted in Table 3. Up to the late 1980s, rates of property crime in the five provinces grew by between four per cent (Ontario) and seven per cent (Saskatchewan) per year (the result of the combined impact of the common constant identified in the second row of Table 3 and the additional province-specific constant term in the third row). The growth trend in the rates of property crime in all five provinces fell significantly around 1990, by between seven and eight percentage points from previous rates of growth (as indicated by the period- and province-specific additions to the growth trend indicated in row four). This was a major turning point in the evolution of property crime, and coincided with the drop in the rate of total criminal code violations in Canada which occurred after the peak in 1991. The figures in the next row of Table 3 indicate the extent of special one-period changes (jumps) in the growth rates of property crime which occurred at the beginning of the trend decline. These identify a significant one-period drop in the rate of property crime for Manitoba in 1988 from a peak in 1987, and significant increases in the rates of property crime for Ontario, Alberta, and British Columbia to peaks in 1991, prior to the model-predicted trend decline in the rates.
TABLE III Province-specific deterministic dummiesa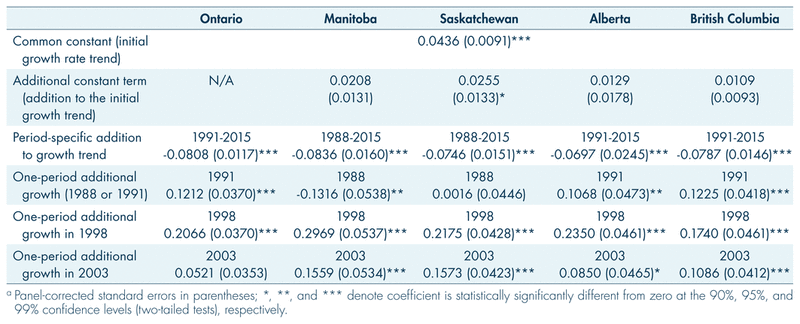
Of particular interest are the one-period jumps in 1998 and 2003. The predicted rates of property crime for the five provinces jumped by approximately 20 per cent in 1998. This substantial change is attributed to the change in reporting methodology, from UCR1 to UCR2 in 1998. Many offense categories expanded in detail, and some offenses were re-categorized from the “Other Criminal Code” category to either of the property crime or violent crime categories under UCR2 coding. Significant one-period, model-predicted jumps in property crime rates above the trend decline also occurred in 2003 in Manitoba (16%), Saskatchewan (16%), Alberta (9%), and in British Columbia (11%), as indicated in the last row of Table 3, and in Figure 1. This increase in rates of property crime in 2003 has been attributed to changes in reporting procedures “which make it easier for the public to report minor crimes to the police” (Wallace, 2004:4). As an example, the major increase of minor thefts in Winnipeg in 2003, and of auto thefts in particular, was tied to the introduction of a telephone reporting system by the Winnipeg Police Service (Wallace, 2004:11). These types of reporting changes were also experienced elsewhere. Tonry (2014) indicated that many countries have changed how they report crime incidents, by moving from an “output” system in which crime is officially reported after police screening, to “input” systems, where crime is officially reported with less police screening and investigation. In 2002/03, the police-reported crime rate in England and Wales rose by 10 per cent as a result of the shift from an output to input system (Simmons & Dodd, 2003).
The empirical results suggest that rates of property crime will decline with improvements in economic conditions and increasing prosperity, with reductions in the share of youth in the total population, and with reductions in migration turnover, in the short term. Rates of property crime have risen in Manitoba, Saskatchewan, Alberta, and British Columbia over the past two years, and this corresponds to the drop in oil prices and pause in the commodity boom, and a rise in unemployment. If economic conditions continue to weaken and if the unemployment rate continues to rise, then the property crime rate is expected to continue to rise. If the degree of migration turnover remains high as people move to seek opportunities, it is expected that rates of property crime will remain high relative to the rates in the early part of the last decade. Policies that can strengthen the economy, in both resource and non-resource sectors, and that provide businesses with a favourable climate to create jobs and decrease unemployment, are especially welcome in difficult times, given policymakers have limited influence over international resource price changes. Policymakers and justice officials also have limited influence over migrants’ decisions to relocate, but they may be better prepared and able to formulate and target additional crime prevention measures knowing that population movements and economic slowdowns tend to increase crime rates. The results presented herein also indicate how crucial it is to incorporate relevant province- and time-specific effects into the analysis to show that changes in the economic and demographic variables are important, yet incomplete, predictors for changes in rates of property crime.
The one-period growth rate changes which occurred in 1998 and in 2003 were substantial, leading to large upward shifts in the rates of property crime in 1998, and again in 2003, as shown in Figure 1. These large and lasting increases in rates of property crime have been attributed to changes in crime categorization in the UCR2 coding, and to recording practices as police have moved from output to input systems of recording. Policymakers and justice professionals may be advised and reminded of how changes in recording practices and methods may have substantial effects on police-reported crime rates, and to exercise caution when examining trends over time. Comparisons of crime rates, between those in the 1990s and those in the 2010s as an example, are not advisable without taking into account these changes in reportingmethodology.
The shift from growing to falling rates of property crime occurred in the late 1980s in Saskatchewan and Manitoba, and in the early 1990s in British Columbia, Alberta, and Ontario. This long-run trend shift has also been experienced in most developed countries, and has yet to be conclusively explained. Levitt (2004) examined the recent crime decline in the US, and provided evidence to discredit some prominent explanations and to conclude that the increased number of police, the increase in incarceration, the diminished crack cocaine problem, and the legalization of abortion and reduction in unwanted births and child poverty were the prominent causes of the US decline in crime since the early 1990s. These explanations are not particularly useful, however, for other nations experiencing similar transitions in crime rate trends, but dissimilar changes in policing and/or incarceration, and differing drug and abortion environments. Mishra & Lalumiere (2009) added to the literature by suggesting that a decrease in risky behaviour among youth contributed to the crime drop in the US and Canada, while van Dijk, Tseloni & Farrell (2012) pointed also to the influence of situational crime prevention initiatives as a possible factor to the decline in crime. Farrell et al. (2014) tested the major hypotheses proposed to explain the recent drop in crime in industrialized nations, including those of Levitt (2004), and concluded that the timing and patterns of the drop in crime in various countries could be best tied to the timing and patterns of security improvements, and these security improvements may have contributed to declines in many crime types through spillover effects. Research continues to better understand this important recent Canadian and international long-run trend decline in crime.
This article provides an empirical assessment of the changes in rates of property crime over the period from 1968 to 2015, to uncover the impact of economic and demographic change on rates of property crime in British Columbia, Alberta, Saskatchewan, Manitoba, and Ontario. The results suggest that increasing incomes and alcohol sales per capita, and decreasing unemployment rates, all indicative of improved economic conditions, coincided with declines in rates of property crime. The results also suggest that a declining share of youth to the total population coincided with decreases in rates of property crime, while increasing migration turnover (both inwards and outwards migration) put upward pressure on rates of property crime. Both of these demographic changes are typically experienced during times of improved employment opportunities with counteracting effects on property crime.
These findings help to explain how resource and economic booms in the west helped bring down rates of property crime, as well as to inform policymakers how the more recent resource and economic slowdown has put upward pressure on rates of property crime. In addition, the results presented herein indicate the strong role changes in reporting practices and methodology have had on official police-reported crime statistics, of which policymakers and analysts must be aware before characterizing crime rates in different periods, and in considering policy changes. Lastly, while this article helps to identify the quantitative nature of the change from growing to declining rates of property crime that occurred in the late 1980s and early 1990s, the causes have not yet been fully identified. More research is needed to explore long-run trends in rates of property crime, including the exploration of a role for the timing and patterns of security improvements in Canada, as well as for differences in the patterns of—and influences over—the sub-categories of property crime.
This work has been supported by resources and funding from the Collaborative Centre for Justice and Safety, the Saskatchewan Ministry of Corrections and Policing, and the Royal Canadian Mounted Police F Division. This work is related to a project on the economics of crime and corrections with financial assistance from the Saskatchewan Ministry of Corrections and Policing, and to a project on the impact of economic and demographic change on crime and policing supported by and with financial assistance from the Collaborative Centre for Justice and Safety and the RCMP F Division. The author acknowledges encouragement and assistance from Steve Palmer of the Collaborative Centre for Justice and Safety, Brian Rector of the Research and Evidence-Based Excellence Branch of the Saskatchewan Ministry of Corrections and Policing, and from Nina Sahasrabuddhe of the RCMP F Division. Material in this article was presented at the 13th WEA International Conference in Santiago Chile, January 2017, and the author acknowledges feedback from conference participants. The author also gratefully thanks the editor and the anonymous reviewers of this Journal who provided very helpful comments. Any errors of fact or interpretation remain solely those of the author.
The author acknowledges funding support, but no editorial involvement, from the Saskatchewan Ministry of Corrections and Policing and the RCMP F Division. The content reflects the author’s sole opinions and do not reflect those of the Saskatchewan Government nor those of the RCMP. The author states that there are no known conflicts of interest.
*Department of Economics, University of Regina, Regina, SK, Canada.
Albertson, K., & Fox, C. (2012). Crime and economics: An introduction. New York, NY: Routledge.
Andresen, M. A. (2013). Unemployment, business cycles, crime, and the Canadian provinces. Journal of Criminal Justice, 41, 220–227.
Baltagi, B. H. (2005). Econometric analysis of panel data, 3rd. edition. Chichester, UK: John Wiley and Sons Ltd.
Brennan, S. (2012). Police-reported crime statistics in Canada, 2011. Juristat, Statistics Canada Catalogue no. 85-002-X. Ottawa, ON: Statistics Canada.
Bunge, V. P., Johnson, H., & Balde, T. A. (2005). Exploring crime patterns in Canada. Stats Canada Crime and Justice Research Paper Series, Catalogue #85-561-MIE No. 005. Ottawa, ON: Statistics Canada.
Butcher, K. F., & Piehl, A. M. (1998). Cross-city evidence on the relationship between immigration and crime. Journal of Policy Analysis and Management, 17, 457–493.
Cook, P. J., & Zarkin, G. A. (1985). Crime and the business cycle. Journal of Legal Studies, 14, 115–128.
Farrell, G., Tilly, N., & Tseloni, A. (2014). Why the crime drop? In Tonry, M. (editor), Crime and justice: A review of research, Vol 43 (pp. 421–490). Chicago, IL: University of Chicago Press.
Gannon, M., Mihorean, K., Beattie, K., Taylor-Butts, A., & Kong, R. (2005). Criminal justice indicators. Stats Canada Catalogue #85-227-XIE. Ottawa, ON: Statistics Canada, Canadian Centre for Justice Statistics.
Kitchen, P. (2007). Exploring the link between crime and socio-economic status in Ottawa and Saskatoon: A small geographical analysis. Ottawa, ON: Research and Statistics Division, Department of Justice Canada.
Levitt, S. D. (2004). Understanding why crime fell in the 1990s: Four factors that explain the decline and six that do not. Journal of Economic Perspectives, 18, 163–190.
Mishra, S., & Lalumiere, M. (2009). Is the crime drop of the 1990s in Canada and the USA associated with a general decline in risky and health-related behavior? Social Science and Medicine, 68, 39–48.
Pernanen, K., Cousineau, M., Brochu, S., & Sun, F. (2002). Proportions of crimes associated with alcohol and other drugs in Canada. Ottawa, ON: Canadian Centre on Substance Abuse. Retrieved from CCSA: http://www.ccsa.ca/Resource%20Library/ccsa-009105-2002.pdf
Plecas, D., Evans, J., & Dandurand, Y. (n.d.). Migration and crime: A Canadian perspective. Vancouver, BC: The International Centre for Criminal Law Reform and Criminal Justice Policy.
Raphael, S., & Winter-Ebmer, R. (2001). Identifying the effect of unemployment on crime. Journal of Law and Economics, 44, 259–283.
Savoie, J. (2008). Neighborhood characteristics and the distribution of crime: Edmonton, Halifax and Thunder Bay. Crime and Justice Research Paper Series, Catalogue #85-561-M–No. 010. Ottawa, ON: Statistics Canada, Canadian Centre for Justice Statistics.
Simmons, J., & Dodd, T., editors. (2003). Crime in England and Wales, 2002–2003. London, UK: H. M. Stationary Office.
Stevens, G., Odynak, D., Brazil, J., & Hartnagel, T., editors. (2011). Demographic trends and crime in the province of Alberta. Calgary, AB: The Centre for Criminology and Justice Research.
Stock, J. H., and Watson, M. W. (2003). Introduction to econometrics. New York, NY: Addison Wesley.
Tonry, M. (2014). Why crime rates are falling throughout the Western World. In Tonry, M., (editor). Crime and justice: A review of research, Vol 43 (pp. 1–64). Chicago, IL: University of Chicago Press.
van Dijk, J., Tseloni, A., & Farrell, G. (2012). The International Crime Drop. New York: Palgrave Macmillan.
Wallace, M. (2004). Crime statistics in Canada, 2003. Ottawa, ON: Statistics Canada, Canadian Centre for Justice Statistics.
Wilson, S. J., Sagynbekov, K. I., Pardy, T., & Penner, J. (2015). The changing economy and demography of Saskatchewan and its impact on crime and policing. Phase II Report: Influences on criminal behaviour—theory and evidence. Regina, SK: Collaborative Centre for Justice and Safety.
Wilson, S.J. (2017). Saskatchewan crime patterns and determinants. Regina, SK: Collaborative Centre for Justice and Safety. (Manuscript submitted for publication).
Zhang, H. (2014). Immigration and crime: Evidence from Canada. CLSRN Working Paper No 135. Vancouver, BC: Canadian Labour Market and Skills Researcher Network.
This work is licensed under the Creative Commons Attribution-NonCommercial-NoDerivatives 4.0 International License. To view a copy of this license, visit http://creativecommons.org/licenses/by-nc-nd/4.0/. For commercial re-use, please contact marketing@multi-med.com.
1Panel dataset estimation provides several advantages over individual time series estimation, including “more informative data, more variability, less collinearity among the variables, more degrees of freedom and more efficiency” (Baltagi, 2005, p. 5). ( Return to Text )
2Nonstationary series, including the undifferenced series in this analysis, exhibit stochastic trends which may lead such series to appear to be related over the long run when they aren’t, resulting in a spurious regression. For more information on issues regarding nonstationarity and spurious regressions, please refer to Stock and Watson (2003, pp. 460–462). ( Return to Text )
Journal of CSWB, Vol. 3, No. 2, October 2018