FIGURE 1 Community safety planning.
Delphine Gossner*, Terri Simon*, Brian Rector*, Rick Ruddell†
ABSTRACT
This research examined the relationship between case planning indicators and recidivism for a sample of medium and high risk Canadian probationers sampled from two separate probation offices operating under the same policies and standards. A scale that measured completeness of case planning based on an evidence-based, outcome-focused case planning model called Community Safety Planning, revealed significant differences in case planning completeness between the samples with the probation office reporting higher levels of completeness demonstrating significantly lower levels of recidivism. This effect was also observed when investigating the entire sample; high-risk probationers with more complete case plans had 52 per cent less recidivism than high-risk probationers with less complete case plans. The nature of communication between probation and police services on an individual case basis was also examined in an effort to better understand how these partnerships are currently functioning, and whether there is opportunity to improve the strategic nature of the communication to achieve the common goal of community safety. Implications for best practices in case management with offender populations are offered.
Key Words: Probation, case management, recidivism, program integrity
Over the last four decades, empirical research has resulted in the identification of evidence-based principles that, when properly implemented, demonstrate significant reductions in the reoffending behaviour of offenders, known as the Risk-Needs-Responsivity (RNR) Model of Correctional Assessment and Treatment (Andrews & Bonta, 2010). The Risk Principle promotes the use of validated risk assessments to identify offenders who are at the highest risk to re-offend. Once classified as high risk, the Risk Principle directs that high intensity services be provided to these offenders in order to reduce their recidivism. Research on high-risk offenders and their criminal behaviour reveals that, although they represent a relatively small proportion of the offender population, they are responsible for a disproportionately high amount of crime (Cohen, Plecas, McCormick & Peters 2014; Piquero, 2000). As such, any reoffending reductions with this group will have significant, positive effects on public safety. Next, the Need Principle notes that, when working with offenders, interventions that target factors directly related to criminal behaviour will have the largest impact on reducing future crime. These factors are referred to as criminogenic needs and include areas such as: antisocial/pro-criminal attitudes and cognitions; pro-criminal associates; antisocial personality factors such as impulsiveness and low self-control; low educational/vocational achievement and lack of attachment to education/employment; lack of attachment to pro-social leisure activities and family factors. Lastly, the Responsivity Principle promotes the use of cognitive behavioural programming when addressing criminogenic needs. Cognitive behavioural approaches have been demonstrated to have a strong, positive impact on reducing future criminal behaviour (Lipsey, Chapman & Landenberger, 2001). The Responsivity Principle also states that programming responsive to the unique characteristics of offenders allows for greater engagement in learning and, in turn, greater likelihood in achieving attitudinal and behavioural changes that reduce recidivism.
Altogether, the RNR model identifies who should be prioritized (high-risk offenders), what type of interventions should be provided (criminogenic programming), and how interventions should be delivered (cognitive behavioural with attention paid to offenders specific responsivity issues). These principles have been demonstrated to be applicable across a wide range of offenders and offending behaviour.
In North America, these core principles are familiar to correctional agencies and many elements of the RNR model have been adopted. For instance, the use of validated risk assessments in North American correctional agencies is the norm rather than the exception (Hannah-Moffat & Maurutto, 2003). Structured group programs attending to RNR principles are also a common element in correctional environments and have been the subject of many well-designed evaluation studies demonstrating their effectiveness (Lipsey, Chapman, Landenberger & Wilson, 2007; Tong & Farrington, 2006; Wilson, Bouffard & Mackenzie, 2005), particularly when these structured group programs demonstrate high program integrity (Andrews & Dowden, 2005; Duwe & Clark, 2015; Lipsey et al., 2001; Lipsey et al., 2007; Lowenkamp, Latessa & Smith, 2006).
Program integrity can be described as ‘the degree with which a correctional treatment program is delivered as designed’ (Koetzle Shaffer & Pratt, 2009, p.105). From a perspective of effective correctional intervention, program integrity includes adherence to the RNR principles as well as broader principles including staff training and supervision, and monitoring and evaluation, to name a few (Andrews & Bonta, 2010; Dowden & Andrews, 2004; Gendreau & Andrews, 1996). These principles have been operationalized into measures of program integrity such as the Correctional Program Assessment Inventory (CPAI) (Gendreau & Andrews, 1996) and the Correctional Program Checklist (CPC) (Latessa, 2005, 2012). Importantly, both of these measures have been validated against the outcome of recidivism; programs that demonstrate high program integrity, as measured by either the CPAI or CPC, also demonstrate lowered recidivism rates as compared to programs demonstrating low program integrity which have been shown to increase recidivism (Blair et al., 2014; Lowenkamp, 2003; Nesovic, 2003).
Measures of program integrity are important advancements for agencies delivering correctional services. Although the principles of effective correctional interventions are well known in the field, outcomes of real-world correctional work have not been promising. For instance, Bonta et al. (2008, p.251) reported preliminary results of a meta-analysis on the effectiveness of community supervision, and noted when comparing offenders receiving supervision to a) alternative sanctions such as prison or fines or b) shorter versus longer supervision periods, “the decrease in [general] recidivism associated with community supervision was extremely small [2%]”, and when considering violent offending, no recidivism differences in the groups were observed. It was concluded that, based on these results, community supervision does not appear to be effective. A vast majority of North Americans under correctional supervision are managed in the community. In the United States, Herberman and Bonczar (2015) report that 4,751,400 adult offenders were supervised on a probation or parole order at the end of 2013. In Canada, approximately 100,000 offenders were serving probationary or parole sentences in the community on any given day in 2013–14, representing 82 per cent of the national offender population (CCJS, 2015). Consequently, the effectiveness of community supervision is a significant community safety concern and in order to improve community supervision outcomes, integrity in the implementation of the RNR model is necessary (Bourgon, Bonta, Rugge, Scott & Yessine, 2010).
The most common service delivery method in community corrections is a case management model (Day, Hardcastle & Birgden, 2012). Offenders are assigned to individual probation officers who are responsible for creating a plan for supervision. In some models, the probation officers deliver a service directly (e.g., individual and/or group programming) and in others, the probation officer may be more of a referral agent (Healy, 1999). Systematic integration of effective correctional interventions into case management processes across entire systems (e.g., on a provincial, state or national level), however, has proved challenging (Bourgon et al., 2010; Taxman, 2012).
Implementing effective correctional interventions across an entire system begins with incorporation of these principles in policies governing the work of the case manager. Next, the principles need to be operationalized and translated to the day-to-day work done by case managers. In order to ensure program integrity of effective correctional interventions at the individual case level, the case management delivery system must reflect these principles in a manner that allows for quantitative measurement. This type of approach allows for an objective review of the program integrity at a case level which can then be measured against outcomes of recidivism to determine effectiveness, much like the CPAI and CPC.
An example of a correctional case management model is the Community Safety Planning (CSP) model developed in Saskatchewan. CSP is informed by the effective correctional intervention principles of RNR, with an objective of enhanced public safety through reduced recidivism and offender accountability. The model is supported by correctional policies directing prioritization of services to the highest risk offenders (Risk Principle) and offenders convicted of serious violent offences.
One of the challenges for any agency leadership is program fidelity; that is, ensuring front-line staff members carry out their duties in a manner that is faithful to the model in order to achieve desired outcomes (Drake, 2013; Spohr, Taxman, Rodriguez, et al., 2015). In the CSP model, program fidelity is advanced through training of probation officers and supervisors in case management skills within each element of the CSP. This training includes a traditional workshop environment, but also requires probation officers and supervisors to demonstrate their ability to apply the concepts and skills with real-life cases. This skill application is evaluated against predetermined standards through supervision, and coaching is provided until this standard is met. Even once mastery of the concepts and skills is achieved, ongoing supervision of both probation officers and supervisors is provided to maintain program fidelity.
CSP consists of three components: comprehensive assessment of the offender’s circumstances including, but not limited to, a risk and criminogenic needs assessment; risk management interventions through supervision and other environmental structures; and risk reduction through rehabilitative interventions designed to reduce re-offending over time. The elements of CSP are graphically represented in Figure 1.
|
|
||
|
FIGURE 1 Community safety planning. |
||
The CSP framework is informed by the RNR model as well as: a) incorporating relapse prevention, an important intervention identified as effective with offender populations (Dowden & Andrews, 2007; Dowden, Antonowicz, & Andrews, 2003); b) emphasizing the role of probation officers as agents of change through the use of core correctional practices (Dowden & Andrews, 2004; Bonta et al., 2008; Gliecher, Manchak & Cullen, 2013; Raynor, Ugwudike & Vanstone, 2014; Robinson, et al., 2012; Smith, Schwietzer, Labrecque, & Latessa, 2012); and c) involvement of support persons/agencies in the community (Altschuler and Armstrong, 1994; Taxman, 1998) to support the offender during and after the community sentence. Within CSP, police agencies are conceptualized as one of the support agencies in the community for risk management and risk reduction of probationers.
The responsibility for supervising offenders serving community sentences is primarily delegated to community corrections agencies either through conditions identified by courts or as the result of community supervision built into custodial sentences. Despite the large number of offenders serving sentences in the community, resources in community corrections agencies to supervise and provide rehabilitative services to all offenders are often not commensurate to the need.
Including other stakeholders with a responsibility for public safety in the supervision and rehabilitative services for offenders has the potential to contribute to lower recidivism rates. Police are an example of a stakeholder who also has as their mandate the protection of society. Both police and probation agencies are tasked with public safety and more often than not are working with the same individuals. As such, it is not surprising that informal police–probation partnerships have naturally developed across North America and have existed for decades (Matz & Kim, 2013). These informal partnerships are characterized as highly individualized and based on agreements between persons in the respective agencies to work together. This may be related to one specific case, or for a number of offenders on a particular caseload or area, but are not part of the structure in the form of policies or procedures of either agency. As a result, if the individuals who agree to work together move on to other duties, the partnership dissolves.
Formal police–probation partnerships began to emerge in the early 1990s, and they range from enhanced supervision partnerships to interagency problem-solving partnerships (Matz & Kim, 2013). Although these partnerships are described as formal, the models differ with respect to their purpose, degree of information sharing, and role definition. Further, their effectiveness at reducing recidivism has been inconclusive (Matz & Kim, 2013).
While correctional agencies are familiar with the RNR model, these principles have not consistently been translated to the police–probation partnerships. Matz and Kim (2013) suggest the RNR model should be communicated to the law enforcement agencies in order to achieve the goal of enhanced public safety, particularly in the context of police–probation partnerships. When police–probation partnerships do incorporate the principles of the RNR model in a strategic way, positive impacts on reducing reoffending are demonstrated (Paparozzi & Gendreau, 2005; Lowenkamp, Flores, Holsinger, Makarios & Latessa, 2010).
CSP has the potential to change agency behaviour through policies and procedures in order to achieve positive community safety outcomes. However, the degree to which the model alters front-line practices and the subsequent impact on offender behaviour is an important question (Taxman, 2012). In order to shed light on this issue, two quantitative investigations of CSP implementation in Saskatchewan have been conducted. The first explored the degree to which CSPs completed for Saskatchewan young offenders (aged 12 to 17 years) adhered to the risk, need, and responsivity principles and the resulting impact on recidivism (Luong & Wormith, 2011). The results of this study demonstrated that increased adherence to the need principle in the CSP reduced recidivism by 21 per cent, and a larger reduction occurred (30%) when only high-risk cases were examined. Further, under-treatment or no intervention for high-risk offenders in the planning process resulted in a 30 per cent increase in recidivism compared to planning that properly implements CSP (Luong & Wormith, 2011). In summary, the results demonstrate that CSP benefits all youthful offenders but more so for high-risk youth.
The second investigation focused on very high risk, serious violent young offenders and the impact comprehensiveness of CSP had on recidivism (Carey, et al., 2011). Very high risk was determined through the use of a validated risk assessment, the Level of Service Inventory-Sk Youth Edition (LSI-Sk). Serious violent offending was based on level 2 and 3 violent offending as identified by the Canadian Centre for Justice Statistics (e.g., a level 2 assault, for instance, is carried out with a weapon or causes bodily harm, whereas a level 3 offence is an aggravated assault that results in maiming or endangering life). A scale was created which quantified elements of the CSP based on predetermined criteria. For example, the files were reviewed for the presence of a completed primary risk assessment; the risk assessment administration had to be valid, defined as: a) meeting provincial standards including having been completed by a youth worker who had demonstrated a high level of competency in administering the assessment through clinical supervision; b) documentation of evidence to back up scoring decisions; c) a report interpreting the results of the assessment; and d) based on the current circumstances of the youth and sentence. Presence of this information contributed to a specific score as part of the measurement of the Risk/Need Profile component of the CSP. Each component of the CSP had a similar quantification which cumulated in an overall score of CSP comprehensiveness.
Examination of the CSP data revealed that, when completeness of case planning was evaluated to be high, there was a 44 per cent reduction in recidivism (the average follow-up period for the sample was two years) for very high risk serious violent young offenders. These findings resulted in a province-wide implementation of a mastery standard in CSP for all youth workers responsible for case management in order to ensure all future CSPs were of the highest quality. In addition, an advanced mastery standard was required for all supervisors of youth workers in order to support the quality and completeness of all case planning.
The focus of the current research was to extend previous results investigating the application of CSP with young offenders to a sample of adult probationers assessed as being medium or high risk and/or convicted of a serious violent offence. A key element in this study was the continued investigation of the development of a scale to measure program integrity of case planning, and evaluating the degree to which more complete case planning was related to reduced recidivism.
This study also sought to shed light on the support persons’ component of the CSP. While there are no policies directing collaboration between probation and police officers, informal partnerships between the two agencies are common in Saskatchewan. The investigators were interested in examining and quantifying the degree of collaboration between probation and police services, from informal communication to more formal arrangements that included evidence of strategically planning risk management and risk reduction strategies. The purpose was to gain information in order to inform prospective practices for partnerships and establish a baseline for evaluation in future investigations.
Subjects of this study were comprised of adult probationers from two probation offices, both operated by the Saskatchewan Ministry of Justice, Corrections and Policing. As a result, the case management policy standards were identical, and employee characteristics, caseload size, and deployment were similar. All offenders convicted with a serious violent offence, regardless of risk level, were selected for inclusion in the study, along with random samples of high and medium risk offenders. File reviews were conducted where an investigator examined each offender’s file against a number of predetermined criteria and assessed whether the case plan met measurable standards against all elements of the CSP, as specified in Figure 1. Data from the file reviews were matched with recidivism data extracted from the provincial corrections database. Recidivism was defined as a conviction resulting in re-admission to the provincial correctional system for a new offence within one year.
Altogether, four measures were used in the course of this study. The Saskatchewan Primary Risk Assessment (SPRA) is a 15-item instrument that was designed to assess and predict the risk of general recidivism and criminogenic needs among provincial offenders (O’Bourne, 2003; Patrick, Orton & Wormith, 2013). The risk factors assessed by the SPRA include: Age, Gender, Criminal History, Residence Stability, Education/Employment, Financial Situation, Family/Marital Relationships, Peers, Drug and Alcohol Use, Pro-criminal Attitude, Antisocial Behavior and Self Management Awareness. With the exception of Age, Gender and Criminal History, which are considered static risk factors, the remaining risk factors are classified as criminogenic needs.
When identified by the assessor as contributing to risk, these criminogenic needs become the intervention targets in the Community Safety Plan. Items are assessed based on criteria identified in a scoring manual and scores range from a low of 0 indicating no risk, or a score of 1, and for some items 2, which indicates presence of risk. These 15 items are summed to create a total score ranging from 0 to 22. The total scores are used to classify the individual’s risk level. Offenders who score within a range of 0 to 5 are classified as low risk. By contrast, probationers with a score between 6 and 11 are classified as medium risk, and those scoring 12 to 22 are classified as being at high risk for reoffending. Recidivism rates, within a three-year follow-up in the community, for low, medium, and high risk Saskatchewan offenders are 20 per cent, 50 per cent and 80 per cent, respectively (O’Bourne, 2004).
In addition to the SPRA, two additional instruments were used to assess offenders with histories of sexual and domestic violence offences. The Static-99 was used to predict the likelihood of sexual recidivism (Hanson & Thornton, 2000) and the Ontario Domestic Assault Risk Assessment (ODARA) was used to predict the likelihood of recidivism for domestic violence (Hilton, et al., 2004).
Last, the Case Management Scale (CM Scale) was used to investigate the impact of comprehensive case planning with adult offenders. This scale was created to measure program integrity to effective correctional intervention principles by determining how “complete” the case management activities were for each offender (see Appendix A). The scale includes 12 items, with scores for each item ranging from 0 to 4 and a total possible score of 17. If an item was not applicable, it did not count against the case. For example, if the index offence of the offender in question was neither domestic violence or sexual in nature, there was no need to complete the Static-99R or ODARA. Therefore, the items specific to the completion of these two assessments are not applicable. In this case, the total possible score of the scale was 15. The scores were converted to percentages for ease of interpretation. The higher the percentage, the more “complete” the case management.
The Case Management (CM) scale was further disaggregated into two subscales. Items one through seven relate to risk assessment policy adherence, including whether the appropriate risk assessments were administered for the individual offender based on the type of offending. Items eight through 12 relate to intervention, including whether the case plan was developed within policy standard timelines (e.g., within 42 days of offender’s sentencing date), inclusion of criminogenic needs in the case plan as identified by the risk assessments, adherence to policy standards regarding frequency of contact with the offender (e.g., probation officers are required to have, at minimum, weekly face-to-face contact with high-risk offenders), and completeness of relapse prevention planning.
In order to score contact standard compliance, contact frequency was determined by identifying the number of contacts that met policy standards for supervision of offenders in the community, which was divided by the number of weeks supervised in order to come up with a contact frequency rate. These rates were then categorized for use in the CM Scale. A case would receive a score of 0 if there was no contact recorded, a score of 1 for low compliance (1%–33% to contact standard), a score of 2 for moderate compliance (34%–67%), and a score of 3 for high compliance or meeting the standard (68%–100%).
Completeness of the RP plans was assessed by rating whether certain components of RP plans were present, including whether high-risk situations were identified, strategies were identified to deal with the high-risk situations, and collaterals were informed about the RP plan. Collaterals are those people identified by the offender as being able to support them in maintaining positive pro-social changes and can include family, peers, employers, other involved service providers (Altschuler and Armstrong, 1994). These components of RP have been flagged in the literature as aspects that make RP plans more effective, demonstrating larger reductions in recidivism than plans that do not include the components (Dowden & Andrews, 2007).
The sample consisted of 183 offenders who were under community supervision orders in two regions (Region A, n = 78; Region B, n = 105). Both of the regions from which these samples were drawn were located in rural municipalities with a main probation office situated in a small urban center (civic populations were less than 20,000) with responsibility for offenders in both the urban and rural areas, the latter of which represents a large geographical area, including serving several First Nations reserves.aTable I presents the offender-related characteristics of the two samples.
TABLE I Demographic characteristics of the two samples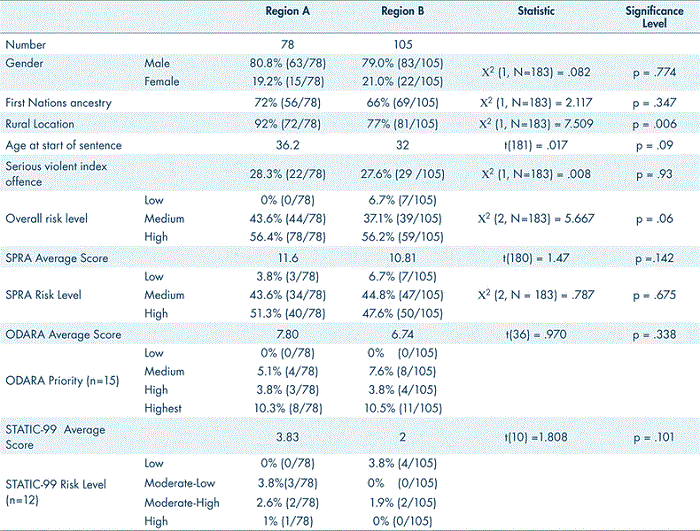
About four-fifths of both samples were male. Both samples had offenders identified as First Nations with Region A reporting a slightly higher proportion than Region B (72% and 66%, respectively) although the differences were not statistically significant (Χ2(1, N=183) = 2.117; p = .347). Both Regions supervised the majority of the offenders in a rural context, although Region A had a significantly higher proportion of rural offenders than Region B (92% and 77%, respectively; Χ2 (1, N=183) = 7.509; p = .006). In terms of age, the offenders in the Region A sample were slightly older than their Region B counterparts at the start of their community sentences (36.2 and 32 years, respectively), but not significantly different (t(181) = .017; p = .09). The proportion of serious violent offenders was similar for both samples.
Information for generalized risk for reoffending as measured by the SPRA was available for 99 per cent (181/183) of the overall sample. Both regions had similar proportions of offenders in each of the three risk categories as assessed by the SPRA (Χ2 (2, N = 183) = .787; p = .675). T-tests revealed no statistically significant difference in average SPRA risk score for the two samples (t(180) = 1.47; p =.142). Depending on offence type and circumstances, information from secondary risk assessments was available for domestic violence (21% of the sample; 38/183) and sexual offending (7% of the sample; 12/183). No statistically significant differences on average scores for either of the secondary assessments were noted between the two samples (ODARA t(36) = .970; p = .338; Static-99 t(10) =1.808; p = .101). Chi-square analysis to determine whether the regions were similarly distributed on these secondary risk assessments were not possible due to low cell counts.
Overall, the samples from each Region were similar on demographic characteristics. With the exception of purposefully over-sampling high risk and serious violent offenders for this study, the sample populations also closely resemble the provincial probation characteristics.
When considering the total scores for the CM Scale, a statistically significant difference between Region A and Region B was noted, with Region A achieving a total score of 48.20 per cent and Region B receiving 61.27 per cent (t(181) = −5.80; p = .000). These results are presented in Table II. When the CM Scale was divided into Assessment (Items #1–7) and Intervention (Items #8–12) subscales, it showed that the offices were nearly equal on the Assessment subscale (Region A = 82.74 and Region B = 85.21; t(181 )= −.816; p = .415), but significantly different on the Intervention subscale (Region A = 35.90 and Region B = 52.76; t(181) = −6.21; p = .000), suggesting Region B achieved higher completion on intervention items than Region A.
TABLE II Case Management Scale results by region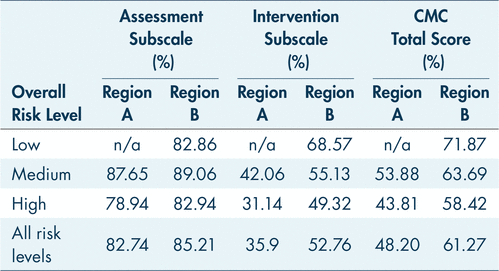
When considering outcomes of the CM Scale for high risk offenders, significant differences were noted between the regions, with lower average scores in Region A (x = 43.81) then Region B (x = 58.42; t(101) = −4.775; p = .000). While average scores for the Assessment subscale did not differ significantly between the regions for high-risk offenders (Region A = 78.94 and Region B = 82.94; t(101) =−.919; p = .360) differences were noted for the Intervention subscale, with significantly lower scores for high-risk offenders in Region A than Region B (x =31.14 and 49.32 respectively; t(101) = −4.975; p = .000).
Medium-risk offenders followed a similar trend with average CM Scale scores significantly lower in Region A then Region B (Region A = 53.88 and Region B = 63.69; t(71) = −3.062; p = .003), no difference for average scores for the assessment subscale (Region A = 87.65 and Region B = 89.06; t(71) = −.342; p = .733), and significantly lower average scores on the Intervention subscale for medium-risk offenders in Region A as compared to Region B (Region A = 42.06 and Region B = 55.13; t(71) = −3.376; p = .001).
Low-risk offenders in Region B were most likely to have the highest overall CM Scale score, as well as scoring the highest on the Intervention subscale suggesting highest level of completion in case planning. While this result seems counter to the Risk Principle, upon closer inspection, these low-risk cases (n = 7) were primarily sex offender cases with child victims or cases where specialized risk assessments for risk of future sexual offending could not be applied due to offender characteristics (e.g., female) or offence circumstances (e.g., non-contact offences such as child pornography). In these cases, the risk for generalized reoffending as measured by the SPRA would have been assessed as low, but the risk for likelihood of future sexual offending could not be actuarially determined. Due to the nature of the offences and victims, the Ministry’s policy directs that these cases be prioritized for supervision and intervention services. The policy also states, however, these types of cases be clinically reviewed for reductions of services. None of these cases had been submitted for clinical review; as such, feedback was subsequently provided to Region B to ensure the cases be reviewed for reduced services in order to ensure the risk principle was not being circumvented.
In order to replicate the Carey et al. (2011) investigation into case management practices, the CM Scale was dichotomized by the median score creating two groups: a) incomplete (scores between 0–53, representing 41.5% of the total sample); and b) complete (scores between 54–100, representing 58.5% of the sample) case plan categories. Comparisons of the two regions are reported in Table III and reveals significant differences for the regions with a higher proportion of incomplete case management practices for Region A as compared to Region B (64.1% versus 24.8%, respectively; Χ2(1, N=183) = 28.525, p = .000). This same trend was noted for all risk levels with significantly more medium- and high-risk cases falling into the incomplete category in Region A as compared to Region B (medium risk Χ2(1, n = 73) = 8.456, p = .004; high risk Χ2(1, n = 103) = 18.467, p = .000).
TABLE III Percentage of cases evaluated as incomplete vs. complete on Case Management Scale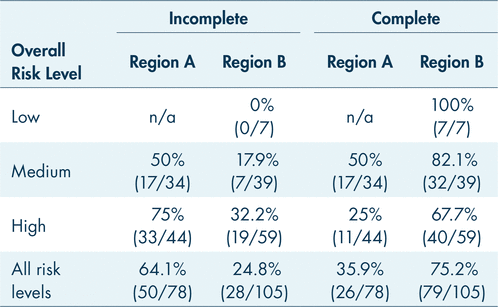
The results presented to this point identify important differences in the CM scale for the two regions with Region A revealing significantly lower scores for CM total score and Intervention subscale suggesting less complete Community Safety Planning in Region A. This trend was noted for the overall sample as well as for high risk offenders. Further, Region A had a higher proportion of incomplete case plans as measured by the CM Scale. All told, case management practices in Region A appear to have less program integrity in the application of effective correction intervention practices. The next step in the analysis was to compare the results of program integrity within case management practices to recidivism outcomes.
Table IV provides recidivism rates for the entire sample broken down by the two Regions and risk levels. The overall recidivism rate of the entire sample was 21.9 per cent (40/183). Recidivism rates for the Region A and B were 28.2 per cent (22/78) and 17.1 per cent (18/105) respectively and were not significantly different (t(181) = 1.75; p = .08). High-risk offenders accounted for the majority of the re-offending behaviour (77.5%; 31/40) with medium risk offenders accounting for the remaining (22.5%; 9/40). When considering only high-risk offenders, Region B had a significantly lower recidivism rate than Region A (22% and 40.9%, respectively; t(101) = 2.12; p = .04).
TABLE IV Recidivism by risk level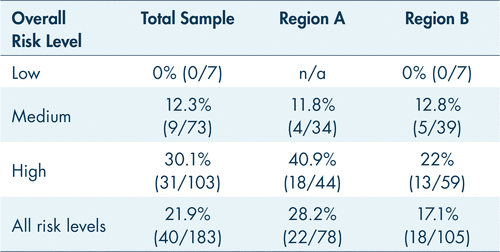
The analyses revealed that on average, recidivists had a lower overall CM Scale (52.32%) than non-recidivists (56.55%), but the difference was not significant (t(181) = 1.482; p = .140). The relationship between the CM Scale total score and recidivism was also not significant (r = −.11; p = .14), although it was in the expected direction (as CM Scale scores increased, recidivism decreased).
With respect to the Assessment subscale, recidivists had higher scores, on average, (86.83%) as compared to nonrecidivists (83.40%), although not significantly different (t(181) = −.947; p = .345). When considering the relationship between the Assessment subscale and recidivism, again, no significant relationship was noted (r = .07; p = .345). Recidivists demonstrated lower scores on the Intervention subscale (40.25%) as compared to non-recidivists (47.06%), although the difference was not significant (t(181) = 1.922; p = .06). The relationship between the Intervention subscale and recidivism was also not significant, but again in the expected direction (r = −.141, p = .06).
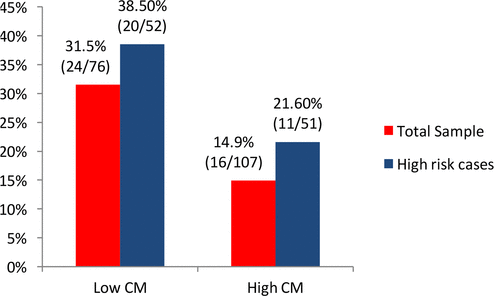
In order to understand the impact of complete versus incomplete case planning on recidivism, the two groups were compared on recidivism rates with results presented in Figure 2. Cases evaluated as having incomplete case plans demonstrated significantly higher recidivism rates when compared to cases evaluated as complete case plans (31.5% vs. 14%) representing a 52.4 per cent difference in recidivism rates (Χ2(1, N = 183) = 7.191, p = .007).
|
|
||
|
FIGURE 2 Recidivism differences based on incomplete versus complete as measured by Case Management Scale. |
||
The previous analysis is based on the overall sample. However, when considering only high-risk offenders and completeness of case planning via the CM Scale, a similar pattern was noted. High-risk cases evaluated to be incomplete by the CM Scale had greater recidivism rates than high-risk cases evaluated to have a complete case plan (38.4% vs. 21.6%) representing a 43.8 percentage difference in recidivism rates (see Figure 2). Chi square analysis revealed a non-significant association when considering the distribution of high-risk recidivists on CM complete versus incomplete categories (Χ2(1, n = 103) = 3.492, p = .062).
When comparing the two Regions, a significantly higher proportion of recidivists in Region A were evaluated as having incomplete case plans as compared to Region B (81.8% vs. 33.3%, respectively; Χ2(1, n = 40) = 9.697, p = .002). Further analysis with only high-risk offenders in the two regions reveals the same trend, a significantly higher proportions of high-risk recidivists in Region A were evaluated as having incomplete case plans as compared to Region B (83% vs. 38%; Χ2(1, n = 31) = 6.639, p = .01).
Altogether, the differences of the two regions in case management practices as measured by the CM Scale were also related to the differences in re-offending rates, in particular with high-risk offenders. When case management practices were evaluated to be more complete, recidivism was significantly lower than when case management practices were less complete. This result was maintained when controlling for risk level. This finding reaffirms the importance not only of strong assessment practice, but also of implementing evidence-based strategies designed to both manage and reduce an offender’s risk in order to contribute to stronger community safety outcomes. It also confirms the importance of focusing on high-risk offenders, given a disproportionate amount of criminal offending is committed by this group and evidence-based case management activities have a significant impact on reducing the likelihood of re-offending.
The level of communication between probation officers and police in case planning as documented in the probationer files was collected only in Region B. As mentioned previously, the purpose of collecting this information was to investigate the level of strategic information probation officers were sharing with police with respect to risk management and reduction strategies for a specific offender. Although these contacts are not required by policy, they are regarded as a desirable practice that may contribute to less recidivism.
Some evidence of communication between probation officers and police was present in 23.8 per cent of the cases (25/105). When there was evidence of contact between the probation and police officers, the level of communication was placed into one of three categories: evidence of some information sharing (indicating that the probation and police officers had contact about the offender, but no details were offered); indication of planning (probation and police officer communicated regarding some aspect of the offender’s risk management, for example, curfew checks); and evidence the police are informed collaterals (police have been informed of the case plan and had a role in the case plan—for instance, being aware of offender’s high-risk situations and communicating with the probation officer as to what they observed in the community). The last category, police as informed collaterals, would be considered to be the highest level of involvement.
For the 25 files that did document police contact, slightly fewer than one-half of these cases (44%; 11/25) demonstrated evidence of some information sharing, and in about one-third of the documented cases (36%; 9/25) there was evidence of planning. Last, in about 16 per cent (4/25) of the cases the police were evaluated as being informed collaterals.
Communication between probation and police officers was also analyzed based on prioritization of cases, as suggested by the Risk Principle, and for serious violent offending (SVO), some of whom would have been high risk. Table V indicates that, regardless of risk or offence type, communication between probation officers and police at the highest level of strategic case planning was infrequent, thus identifying an area for improvement in case management strategies.
TABLE V Probation–Police communication by risk/classification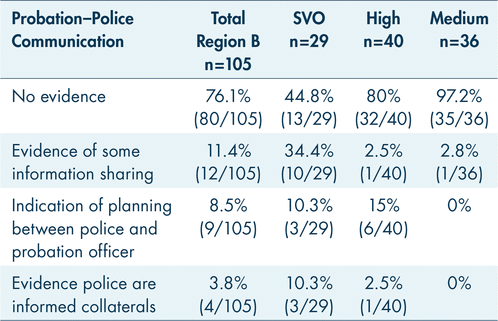
In order to improve community supervision outcomes, integrity in the implementation of the RNR model is necessary (Bourgon et al., 2010). Given the primary service delivery model in community corrections is case management, focusing on how the principles of the RNR model are applied in case planning at an individual level is of important in achieving reduced recidivism of offenders supervised in the community. Taxman (2012) refers to this as ‘science-based supervision’, that is, policies and procedures that incorporate effective correctional interventions as a foundation for managing offenders serving community sentences. Further, science-based supervision requires the identification of a desired outcome and development of performance measures in order to evaluate whether the outcome has been achieved.
This approach challenges correctional services to develop performance measures to evaluate the effectiveness of their services in contributing to overall community safety (Taxman & Belenko, 2012). It also requires agencies to conduct regular reviews to assess the quality of case planning based on predetermined measures, as well as considering what elements of case management activities are contributing to reduced recidivism. The current investigation quantified various elements of an evidence-based, outcome-focused case planning model, Community Safety Planning, and used these elements to create a scale that enabled us to examine what components are related to lower levels of recidivism. The methodology of creating a scale to measure case planning quality and completeness is an extension of the work completed by Carey et al. (2011) with very high risk, serious violent young offenders and extends science-based supervision to adult offenders.
The results of applying a scale to measure case management activities in two comparable probation offices with similar offender characteristics reveal important insights. First, although both offices operate under the same policies, there was a considerable difference in how case management practices were applied as indicated by the statistically significant differences in total scores for the two offices on the CM Scale. When examining the scale in more detail, however, it is noted that the two offices performed equally on the Assessment subscale, but differed in performance on the Intervention subscale. This outcome may be explained by the policy, training, and certification standards implemented in the organization in 2006 which required users of risk assessments to achieve specific criteria in order to be identified as independent administrators of these instruments. This same principle of training and certification has not been applied to the creation and implementation of case plans for adult offenders, and this may account for the difference in performance on the Intervention subscale. In the absence of training and predetermined criteria to demonstrate understanding and competence, success or struggle may be a function of a number of factors within individual offices including: a) the amount of supervision/oversight provided, b) competence of supervisors to provide meaningful feedback to probation officers on particular cases, and c) individual probation officers attitudes towards adherence to RNR principles in case management. Shortcomings in these factors can be overcome by paying attention to staff values towards evidence-based practices and rehabilitation (Paparozzi & Guy, 2013), providing appropriate training in practices demonstrated to effectively change offender behavior (Bourgon, 2013) and ensuring on-going supervision of these practices. As Bourgon (2013, p. 30) notes, “The challenge has been to translate the “What Works” empirical knowledge into concrete and practical everyday behaviors that are effective with criminal justice clients.”
An additional purpose of this research was to consider how probation agencies communicate and collaborate with other partners responsible for community safety. While anecdotally it is suggested there is a high level of communication between probation and police services, how much, what information is shared, and for what purpose is often unknown. The results from this investigation suggests when communication between probation officers and police is documented, the nature of the information sharing tends to be more general in nature rather than strategically collaborating for the shared purpose of community safety on a long-term basis. This strategic collaboration of probation and polices services, informed by what the research identifies as effective in reducing criminal behaviour, has the potential to have a significant positive impact on overall community safety. As a result, it might prove fruitful if investigators in subsequent studies examine the prevalence, nature, and formality of these police–probation relationships.
The present investigation is an important advancement in the creation of a scale to measure quality and completeness of case planning which is demonstrated to be related to reoffending. When it comes to case planning and management, most of the interest from an agency perspective has been in audits with relation to policy compliance, which may or may not be grounded in evidence based practices. The information from these file audits is seldom used in evaluating offender outcomes. This is a significant oversight, as whether community corrections programs are delivered in a manner faithful to how the intervention was developed has a significant impact on recidivism (Bonta et al., 2008; Bourgon et al., 2010). The creation of a scale changes a file audit function from adherence to agency policy to a measure of program integrity and effectiveness in achieving community safety. This type of scale could be applied on an individual case level for the case manager/supervisor to identify where additional focus may be required, or at a caseload/office level for agencies to consider the effectiveness of case management practices and provide interventions and support where there are deficiencies.
While the current study was interested in investigating a methodology to measure program integrity of effective correctional intervention at the case management level, the scale was limited in the number of elements included for evaluation. Future research exploring what dimensions are missing (e.g., dosage of interventions offered, including over- versus under-programming; appropriate programming based on responsivity issues; the extent to which criminogenic needs are addressed) and how these scales can be enhanced (e.g., inclusion of strategic partnerships with other community safety partners) will improve the utility of this approach. Further, although this research extends work done with serious violent high risk young offenders and applies it to adult offenders, the sample size was relatively small and subjects were not randomly assigned, which may have introduced potential differences between the groups that were not accounted for. Additional studies with offender populations with a diversity of characteristics, both in offending and characteristics such as gender, ethnicity, and mental illness, will assist in improving and demonstrating the value of this approach in measuring program integrity in case management.
The results of this and previous work has shaped future directions for Saskatchewan corrections. This includes a continued focus on high risk, serious violent adult probationers through the Serious Violent Offender Response (SVOR), a program designed to increase the strategic integration between probation and police officers with a purpose of decreasing violent recidivism. In addition to advancing the use of effective correctional interventions through training and supervision for both police and probation partners, structures to increase the strategic communication of risk-based information and strategies between police and probation have been implemented. The program includes an evaluation plan to measure effectiveness through measures such as increased offence-free time in the community and reduced recidivism. Outcomes for SVOR are forthcoming. Further, methodologies to automatically code case plan quality based on the elements of Community Safety Planning will be developed which will offer prompt feedback for probation officers and supervisors on the case planning. This will include monitoring recidivism outcomes in order to evaluate the validity of a case management scale as a measure of program integrity using larger sample sizes.
The authors would like to acknowledge the assistance and support they received from the Saskatchewan Ministry of Corrections and Policing for this study, in particular, funding from the Policing and Community Safety Division. The funding sponsor had no role in the design of the study; in the collection, analyses, or interpretation of data; in the writing of the manuscript; and in the decision to publish the results. We would like to thank Murray Sawatsky, Executive Director for Policing and Community Safety, for his support of this research. In addition, we would like to thank Angela Miller for the hours spent reviewing files and collecting data, and Ashley Hoben for data collection and preliminary analysis. Further, thank you to the probation officers and support staff members who aided in the case review. The views expressed are those of the authors and are not necessarily those of the Saskatchewan Ministry of Corrections and Policing.
Brian Rector is a Section Editor for the Journal of Community Safety and Well-Being. He had no role in the selection of peer reviewers for this study, nor did he have any influence on the outcome of the peer review. There are no other conflicts of interest for any of the authors.
*Research and Evidence-based Excellence, Ministry of Justice, Corrections and Policing, Saskatoon, SK; †Law Foundation of Saskatchewan Chair in Police Studies, University of Regina, Regina, SK.
Andrews, D.A., & Bonta, J. (2010). The psychology of criminal conduct (5th ed.). New Providence, NJ: LexisNexis Matthew Bender.
Andrews, D.A., & Dowden, C. (2005). Managing correctional treatment for recidivism: A meta-analytic review of programme integrity. Legal and Criminological Psychology, 10, 173–187.
Armstrong, T.L. and D.M. Altschuler. (1994). Intensive aftercare for high-risk juveniles: A community care model. Washington, D.C.: U.S. Department of Justice, Office of Juvenile Justice and Delinquency Prevention.
Blair, L., Coen Sullivan, C., Lux, J., et al. (2014). Measuring drug court adherence to the what works literature: The creation of the Evidence-based Correctional Program Checklist-Drug Court. Int J Offender Ther Comp Criminol, 60,165–188. doi:10.1177/0306624X14549950 
Bonta, J., Rugge, T., Scott, T. L., et al. (2008). Exploring the black box of community supervision. J Offender Rehab, 47(3), 248–270.
Bourgon, G. (2013). The demands on probation officers in the evolution of evidence-based practice: The forgotten foot soldier of community corrections. Federal Probation, 77(2), 30–35.
Bourgon, G., Bonta, J., Rugge, T., et al. (2010). The role of program design, implementation, and evaluation in evidence-based “real world” community corrections. Federal Probation, 74(1), 2–15.
Canadian Centre for Justice Statistics (CCJS). (2015). Adult correctional statistics in Canada, 2013/2014. Ottawa, ON: Stats Canada. Retrieved from http://www.statcan.gc.ca/pub/85-002-x/2015001/article/14163-eng.htm
Carey, D., Jackiw, J., Simon, T., et al. (2011, June). Relationship between quality case plans for serious violent young offenders and recidivism. Presented at the Canadian Psychological Association Annual Meeting, Toronto, Ontario.
Cohen, I., Plecas, D., McCormick, A., et al. (2014). Eliminating crime: The 7 essential principles of police-based crime reduction. Centre for Public Safety and Criminal Justice Research, Ottawa, Canada. Retrieved from http://cjr.ufv.ca/eliminating-crime-the-7-essential-principles-of-police-based-crime-reduction/
Day, A., Hardcastle, L., & Birgden, A. (2012). Case management in community corrections: Current status and future directions. J Offender Rehab, 51(7), 484–495.
Dowden, C., Antonowicz, D., & Andrews, D. A. (2003). The effectiveness of relapse prevention with offenders: A meta-analysis. Int J Offender Ther Comp Criminol, 47(5): 516–528.
Dowden, C.A. & Andrews, D.A. (2007). Utilizing relapse prevention with offender populations: What works. In Witkiewitz, K.A. and Marlett, G.A., eds., Therapist’s guide to evidence-based relapse prevention. Cambridge, MA: Academic Press.
Dowden, C.A., & Andrews, D.A. (2004). The importance of staff practice in delivering effective correctional treatment: A meta-analytic review of core correctional practice. Int J Offender Ther Comp Criminol, 48(2), 203–214.
Drake, E. (2013). Inventory of evidence-based and research-based programs for adult corrections. Olympia, WA: Washington State Institute for Public Policy.
Duwe, G., & Clark, V. (2015). Importance of program integrity: Outcome evaluation of a gender-responsive, cognitive-behavioral program for female offenders. Criminology & Public Policy, 14(2), 301–328.
Gendreau, P., & Andrews, D.A. (1996). The Correctional Program Evaluation Inventory (6th edition). Saint John, NB/Ottawa, ON: University of New Brunswick and Carelton University.
Gliecher, L., Manchak, S.M., & Cullen, F.T. (2013). Creating a supervision tool kit: How to improve probation and parole. Federal Probation, 77(1). http://www.uscourts.gov/viewer.aspx?doc=/uscourts/FederalCourts/PPS/Fedprob/2013-06/index.html
Hannah-Moffat, K., & Maurutto, P. (2003). Youth risk/need assessment: An overview of issues and practices. Ottawa: Canada Department of Justice. Retrieved from http://www.justice.gc.ca/eng/rp-pr/cj-jp/yj-jj/rr03_yj4-rr03_jj4/rr03_yj4.pdf
Hanson, R. K., & Thornton, D. (2000). Improving risk assessments for sex offenders: A comparison of three actuarial scales. Law and Human Behavior, 24(1), 119–136. doi:10.1023/A:1005482921333
Healey, K.M. (1999). Case management in the criminal justice system. National Institute of Justice — Research in Action, February 1999. Washington, DC: US Department of Justice.
Herberman, E.J., & Bonczar, T.P. (2015). Probation and parole in the United States, 2013. Washington, DC: Bureau of Justice Statistics. Retrieved from http://www.bjs.gov/content/pub/pdf/ppus13.pdf
Hilton, N.Z., Harris, G.T., Rice, M.E., et al. (2004). A brief actuarial assessment for the prediction of wife assault recidivism: The Ontario Domestic Assault Risk Assessment. Psychological Assessment, 16(3), 267–275.
Koetzle Shaffer, D. & Pratt, T.C. (2009). Meta-analysis, moderators, and treatment effectiveness: The importance of digging deeper for evidence of program integrity. Journal of Offender Rehabilitation, 48(2), 101–119.
Latessa, Edward. (2005). The Evidenced-Based Correctional Program Checklist. Center for Criminal Justice Research. Cincinnati, OH: University of Cincinnati.
Latessa, E.J. (2012). Evaluating correctional programs. Washington D.C.: National Institute of Corrections Library: ID 027239.
Lipsey, M.W., Chapman, G.L., & Landenberger, N.A. (2001). Cognitive-behavioral programs for offenders. Ann Am Acad Pol Soc Sci, 578(1), 144–157.
Lipsey, M.W., Landenberger, N.A., & Wilson, S.J. (2007). Effects of cognitive-behavioral programs for criminal offenders. Campbell Systematic Reviews 2007:6 . DOI: 10.4073/csr.2007.6
Lowenkamp, C.T. (2003). Correctional program integrity and treatment effectiveness: A multi-site, program-level analysis [doctoral thesis]. University of Cincinnati.
Lowenkamp, C.T., Latessa, E.J., & Smith, P. (2006). Does correctional program quality really matter? The impact of adhering to the principles of effective intervention. Criminology & Public Policy, 5(3), 575–594.
Lowenkamp, C.T., Flores, A.W., Holsinger, A.M., et al. (2010). Intensive supervision programs: Does program philosophy and the priniciples of effective intervention matter? J Criminal Justice, 38(4), 368–375.
Luong, D., & Wormith, J. S. (2011). Applying risk/need assessment to probation practice and its impact on the recidivism of young offenders. Criminal Justice and Behavior, 38(12), 1177–1199.
Matz, A.K., & Kim, B. (2013). Policy implications of police-probation/parole partnerships: A review of the empirical literature. Federal Probation, 77(2), 9–16.
Nesovic, A. (2003). Psychometric evaluation of the Correctional Program Assessment Inventory (CPAI) [doctoral thesis]. Carleton University, Ottawa, ON.
O’Bourne, P. (2003). Exploring the predictive ability of risk-needs assessment in Saskatchewan Corrections (Unpublished master’s thesis). University of Regina, Regina, SK.
Patrick, G., Orton, L., & Wormith, J.S. (2013). The predictive validity of the Saskatchewan Primary Risk Assessment (SPRA). Centre for Forensic Behavioural Sciences and Justice Studies. Saskatoon, SK: University of Saskatchewan.
Paparozzi, M.A., & Gendreau, P. (2005). An intensive supervision program that worked: Service delivery, professional orientation, and organizational supportiveness. The Prison Journal, 85(4), 445–466.
Paparozzi, M. A., & Guy, R. (2013). The trials and tribulations of implementing what works: Training rarely trumps values. Federal Probation, 77(2), 36–42.
Piquero, Alex R. (2000). Assessing the relationships between gender, chronicity, seriousness, and offense skewness in criminal offending. J Criminal Justice 28(2), 103–115.
Raynor, P., Ugwudike, P., & Vanstone, M. (2014). The impact of skills in probation work: A reconviction study. Criminology & Criminal Justice, 14(2), 235–249.
Robinson, C.R., Lowenkamp, C.T., Holsinger A.M., et al. (2012). A random study of staff training aimed at reducing re-arrest (STARR): Using core correctional practices in probation interactions. J Crime and Justice, 35(2), 1–22.
Smith, P., Schweitzer, M., Labrecque, R. M., et al. (2012). Improving probation officers’ supervision skills: an evaluation of the EPICS model. J Crime and Justice, 35(2), 189–199.
Spohr, S. A., Taxman, F. S., Rodriguez, M., et al. (2015). Motivational interviewing fidelity in a community corrections setting: Treatment initiation and subsequent drug use. J Substance Abuse Treat. Published online ahead of print: doi:10.1016/j.jsat.2015.07.012
Statistics Canada. (2011). Aboriginal peoples in Canada: First Nations people, Métis and Inuit. Ottawa: Stats Canada.
Taxman, F.S. (2012). Crime control in the twenty-first century: Science-based supervision (SBS). J Crime and Justice, 35(2), 135–144.
Taxman, F.S. (1998). Reducing recidivism through a seamless system of care: Components of effective treatment, supervision and transition services in the community. Washington, DC: Office of National Drug Control Policy. Retrieved from: https://www.ncjrs.gov/ondcppubs/treat/consensus/taxman.pdf
Taxman, F. S., & Belenko, S. (2012). Implementing evidence-based practices in community corrections and addiction treatment. New York: Springer-Verlag.
Tong, L.S.J, & Farrington, D.P. (2006) How effective is the “Reasoning and Rehabilitation” programme in reducing reoffending? A meta-analysis of evaluations in four countries. Psychology, Crime & Law, 12(1), 3–24. doi:10.1080/10683160512331316253
Wilson, D.B., Bouffard, L.A., & Mackenzie, D.L. (2005). A quantitative review of structured, group-orientated, cognitive-behavioral programs for offenders. Criminal Justice and Behavior, 32(2), 172–204.
Has a SPRA been completed? (0 = No, 1 = Yes)
Is the SPRA current? (Review date minus SPRA date ≤ 365 days is current) (0 = No, 1 = Yes)
Is a SPRA Scoring and Information Record (SIR) present? (0 = No, 1 = Yes)
If the ODARA was required, has it been completed? (0 = No, 1 = Yes)
Is the ODARA Scoring Record on the paper file? (0 = No, 1 = Yes)
If the Static-99R was required, has it been completed? (0 = No, 1 = Yes)
Is the Static-99R Scoring Record on the paper file? (0 = No, 1 = Yes)
If a case plan was required (> 42 days in community), has it been completed? (0 = No, 1 = Yes)
Was the case plan completed on time? (0 = No, 1 = Yes)
Is the case plan a SPRA case plan? (0 = No, 1 = Yes)
What is the compliance with the contact standard?b (actual contact ratio/expected contact standard; if medium priority, contact ratio should = 0.5, if high priority should = 1.0), Resulting in a scale of:
■ 0 = No contact
■ 1 = Low compliance (1% – 33%)
■ 2 = Med compliance (34% – 67%)
■ 3 = High compliance (68% – 100%)
■ 0 = No RPP on file
■ 1 = High risk situations (HRS) identified
■ 2 = HRS + informed collaterals
■ 3 = HRS + strategies identified
■ 4 = HRS + strategies + informed collaterals
aFirst nations peoples in Canada are also known as Aboriginal or Indigenous, and are comprised of peoples of Aboriginal ancestry, Peoples from the North (Inuit), and Métis peoples (those of mixed race). See Statistics Canada (2011). ( Return to Text )
bCompliance was calculated by dividing the actual contact ratio (i.e., number of face-to-face contacts per week) by the expected contact standard, then multiplying by 100 to get a percentage. For a medium priority offender, the expected contact standard would have been 0.5 (i.e., one contact every two weeks), while it was 1.0 (one contact per week) for a high priority offender. ( Return to Text )
This work is licensed under the Creative Commons Attribution-NonCommercial-NoDerivatives 4.0 International License. To view a copy of this license, visit http://creativecommons.org/licenses/by-nc-nd/4.0/. For commercial re-use, please contact marketing@multi-med.com.
Journal of CSWB, VOLUME 1, NUMBER 2, August 2016